Why narrative framing analysis?
Part of the motivation behind this series comes from a slight discomfort with the concept of “shaping the narrative” sometimes found in Theories of Change. The concept seems slippery to me and risks turning advocacy into a chase for mentions, mistaking visibility for influence. Still, I wondered whether I was being unfair, and sought ways to better assess its effectiveness.
That led me to narrative framing analyses as a potential Monitoring, Evaluation, and Learning (MEL) tool: could we track how the stories around an issue evolve, and whether advocacy efforts actually move the needle? Furthermore, if we can map how narratives differ across regions or outlets, that same information could guide strategy and prioritization e.g. revealing where certain framings already align with the desired change or where there is an opportunity to fill a narrative gap.

What can narrative framing help with?
-
Understand how a topic is being discussed: Every issue carries multiple possible stories: who is responsible, who suffers, and what counts as a solution. A framing analysis helps reveal which of these stories dominate, and which remain marginal or absent. It could matter because public narratives can influence which kinds of solutions receive attention or legitimacy (caveat: I haven’t look at the evidence on the connection between framing and policy outcomes). For example, if air pollution coverage in Delhi overemphasizes individual behavior while neglecting industrial, power, or agricultural sources, it signals not just a bias in media attention but a structural blind spot in public debate.
-
Prioritise regions, messaging and outlets: Comparing how narratives differ across outlets or regions can reveal where certain perspectives are missing — or, conversely, where the conversation already aligns with desired change. This information could eventually help advocates or funders decide where to focus their attention: in some cases by addressing narrative gaps, and in others by building on more conducive framings.
-
Measure change over time: Tracking how narratives evolve — across repeated studies or advocacy campaigns — could help observe whether certain framings gain or lose prominence. This might support both strategic reflection (for advocates seeking feedback on their efforts) and broader research on how public conversations shift around key issues.
To see what this might look like in practice, I ran three experiments:
- Example 1: Air pollution causes in Delhi, India: identifying gaps between media coverage and scientific evidence on pollution sources
- Example 2: Grand National protest: testing whether Animal Rising’s 2023 disruption had a lasting effect on media framing
- Example 3: Animal welfare in EU party manifestos: mapping how parties across Europe talk about animal welfare and where framings differ
Example 1: Air pollution causes in Delhi, India
In this first exploration, I analyzed how leading English-language newspapers discuss air pollution in Delhi, focusing on which sources of pollution receive attention in coverage. I collected 20,000 articles published between January 2015 and November 2025 across five prominent national newspapers (The Times of India, Hindustan Times, The Hindu, The Indian Express, and The New Indian Express). The analysis identifies distinct narrative frames around pollution sources—from vehicle emissions to industrial activity to seasonal crop burning. This type of application can help advocates compare media framing against scientific evidence to identify narrative gaps and guide communication strategies. (Vital Strategies has conducted similar analysis using different techniques. For technical details on the methodology used here, see the Method overview section below.)
Transportation and Vehicular Emissions
Air pollution caused by emissions from vehicles such as cars, trucks, buses, motorcycles, and other forms of road transport, including references to fuel types (diesel, petrol), vehicle bans, and traffic-related air quality measures.
Industrial and Power Plant Emissions
Air pollution resulting from emissions by factories, manufacturing facilities, power plants (especially coal-fired), and related industrial activities, including references to effluents, industrial waste, and fossil fuel combustion.
Biomass Burning and Agriculture
Air pollution caused by burning of biomass, especially crop residue (stubble burning), agricultural fires, and related rural burning activities, often in neighboring states but impacting Delhi.
Household Fuel and Cooking Emissions
Air pollution from household use of fossil fuels or biomass for cooking and heating, including references to firewood, coal, and domestic burning in homes or small eateries.
Open Waste Burning
Air pollution resulting from the open burning of municipal solid waste, trash, or landfill fires, including explicit references to combustion of waste materials.
Construction and Road Dust
Air pollution caused by construction activities, demolition, roadworks, and resuspended dust from roads or soil, including references to construction and demolition (C&D) waste.
Media attention to air pollution in Delhi follows a distinct seasonal pattern, with coverage surging dramatically during the post-monsoon months (October–November) when pollution levels peak. This pattern is driven several factors: weather conditions that trap pollutants close to the ground, agricultural stubble burning in neighboring states which sends smoke across the region, and year-long local sources whose importance should not be underestimated. The chart below illustrates how this seasonal cycle has shaped media attention over the past decade, with periodic spikes drawing public and policy focus during the worst air quality episodes.

Data Source: Articles are collected via MediaCloud using keywords related to air pollution and filtered to pieces that mention Delhi, New Delhi, NCR, or the National Capital Region. The corpus is limited to the five newspapers listed above.
When examining which pollution sources receive attention in coverage, the results reveal a clear pattern: public conversations about air pollution in Delhi focus heavily on stubble burning, traffic and dust, while year-round emissions from industry and coal-fired power plants receive relatively less attention. This imbalance is reinforced by official narratives that downplay the sector’s role, such as CSIR-NEERI’s claim that SO₂ from power plants is “not significantly affecting ambient air quality” and the environment ministry’s assertion that sulphate aerosols account for only up to 5% of PM2.5. This happens in the context of repeatedly relaxed deadlines for pollution-control equipment. CREA and independent researchers highlight that these conclusions ignore broader evidence that coal burning contributes 10–15% of India’s total PM2.5 burden, while universal installation of flue-gas-desulphurisation systems could prevent tens of thousands of premature deaths.

Note: The chart shows the relative frequency with which different pollution sources are mentioned across all analyzed articles, weighted by article length to reflect the prominence of each frame in the coverage.
Data Sources: Articles are retrieved from MediaCloud. Content has been scraped and processed locally for analysis.
Disclaimer: These results are for demonstration purposes only. The analysis should not be relied upon to provide accurate estimates of media framing trends. Further validation and methodological refinement are needed before these results can be used for research or policy purposes.
Strategic applications
This type of analysis could inform advocacy and funding strategies in several ways:
Identify narrative gaps: By comparing media framing against scientific evidence (e.g., source apportionment studies and emission inventories), advocates can pinpoint where public discourse diverges from reality, creating an opportunity for targeted communication campaigns to shift the conversation.
Compare framing across outlets: Analyzing frame distribution by outlet (shown below) can help identify which media sources already cover under-discussed pollution sources, or conversely, which outlets might be most receptive to new messaging. This enables more targeted media outreach and helps advocates understand whether certain perspectives are systematically absent from specific publications.
Track change over time: By repeating the analysis periodically, advocates can measure whether their communication efforts are shifting public discourse—for instance, whether coal plant emissions gain more prominence in coverage over time. This creates a feedback loop for strategy refinement and provides funders with evidence of progress toward narrative change goals.

Disclaimer: These results are for demonstration purposes only. The analysis should not be relied upon to provide accurate estimates of media framing trends. Further validation and methodological refinement are needed before these results can be used for research or advocacy purposes.
Example 2: Did the Grand National protest shift media framing?
In April 2023, Animal Rising activists disrupted the Grand National1—the UK’s most-watched horse race—by entering the course and delaying the start. The action generated substantial media coverage and and aimed to reignite public debate about the ethics of horse racing.
Social Change Lab conducted an evaluation of the protest’s effects, combining longitudinal panels with cross-sectional surveys. Their findings were nuanced: awareness of the protest was initially linked to worse attitudes toward animals, but these negative effects faded within six months. Cross-sectional comparisons suggested that overall attitudes toward animals had actually improved over that period.
Notably, how people felt about the protest depended on which outlet they heard about it from: those who learned about it through The Guardian or friends and family were more supportive than those who saw it on ITV. This relationship held even after controlling for demographics and pre-existing attitudes toward animals, suggesting an independent effect of media framing (though the authors note this analysis is tentative).
That last finding is particularly relevant here. If media framing shapes public response to protests, then tracking how media frames an issue over time becomes a meaningful outcome in itself.
The chart below shows how coverage breaks down across four frames: Race & Sport (the event itself), Betting & Odds, Celebs & Style (fashion, celebrity attendance), and Welfare & Safety (animal welfare, horse deaths, safety concerns).

Note: The chart shows the relative frequency of each frame across all analysed articles, weighted by article length to reflect prominence in coverage.
Data Source: Over 30,000 articles retrieved from UK newspapers via MediaCloud.
Disclaimer: These results are for demonstration purposes only. Further validation and methodological refinement are needed before drawing firm conclusions.
Two findings stand out. First, the method detected a clear spike in welfare framing in 2023, the year of the protest.
Second, in 2024 and 2025, welfare framing returned to levels only slightly above those pre-protest. The protest generated a surge in welfare-related coverage during the event, but did not appear to durably shift how media frames the Grand National in subsequent years.
However, welfare coverage in any given year could be driven by incidents during the race itself. To isolate the narrative framing from race-day reporting, I repeated the analysis using only articles published before race day each year.

Note: The chart shows the relative frequency of each frame across articles published before race day each year, weighted by article length to reflect prominence in coverage.
Data Source: Articles retrieved from UK newspapers via MediaCloud.
Disclaimer: These results are for demonstration purposes only. Further validation and methodological refinement are needed before drawing firm conclusions.
When restricted to pre-race coverage, the 2023 spike logically disappears. Here again, the results suggest the protest didn’t have a lasting effect on how journalists frame the Grand National in anticipation of subsequent races.
It is important to note that this analysis solely focuses on media framing. The Social Change Lab evaluation found that the protest had other positive impacts beyond media narrative, including improved attitudes toward animals over time and increased mobilisation.
A more granular analysis would break this down by outlet, examining whether certain newspapers shifted their framing more than others in subsequent years.
Strategic applications
Evaluate intervention impact: The Grand National example illustrates how framing analysis can complement other evaluation methods. Social Change Lab measured public opinion and mobilisation; this analysis tracked a different outcome—media narrative. Combining both gives a fuller picture of what an intervention achieved or did not.
Set realistic expectations: The null result here is informative. A highly visible, widely covered disruption generated a spike in welfare framing during the event but didn’t durably shift how media talks about the Grand National. This suggests that one-off actions, however attention-grabbing, may not be sufficient to move narratives long-term.
Track cumulative effects: A single protest may not shift framing, but repeated interventions might. Running this analysis over time could help advocates detect whether sustained campaigning is gradually changing how an issue is discussed, even if individual actions don’t show immediate effects.
Example 3: Animal welfare in European political manifestos
This third application shifts from media analysis to political discourse, examining how European political parties frame animal welfare in their electoral manifestos. The analysis covers manifestos published since 2018 spanning 36 countries and 29 languages, and were collected from the Manifesto Project dataset. It is important to note though that these manifestos may represent different types of elections and may therefore lead to biased cross-country comparisons; a more thorough analysis would further discriminate by election type.
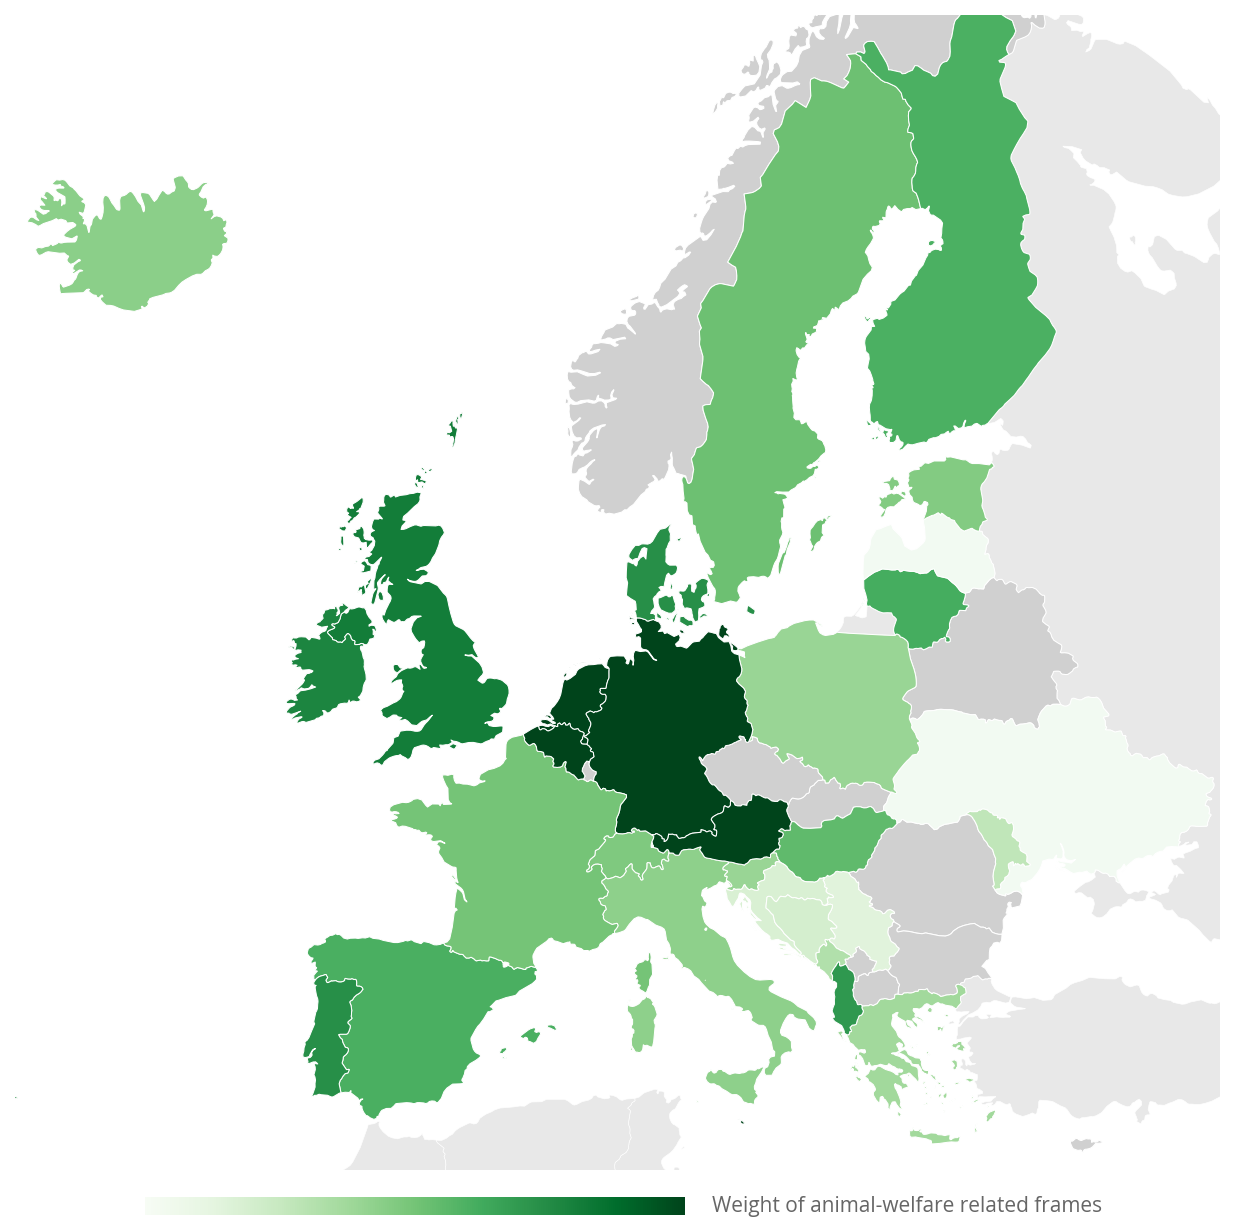
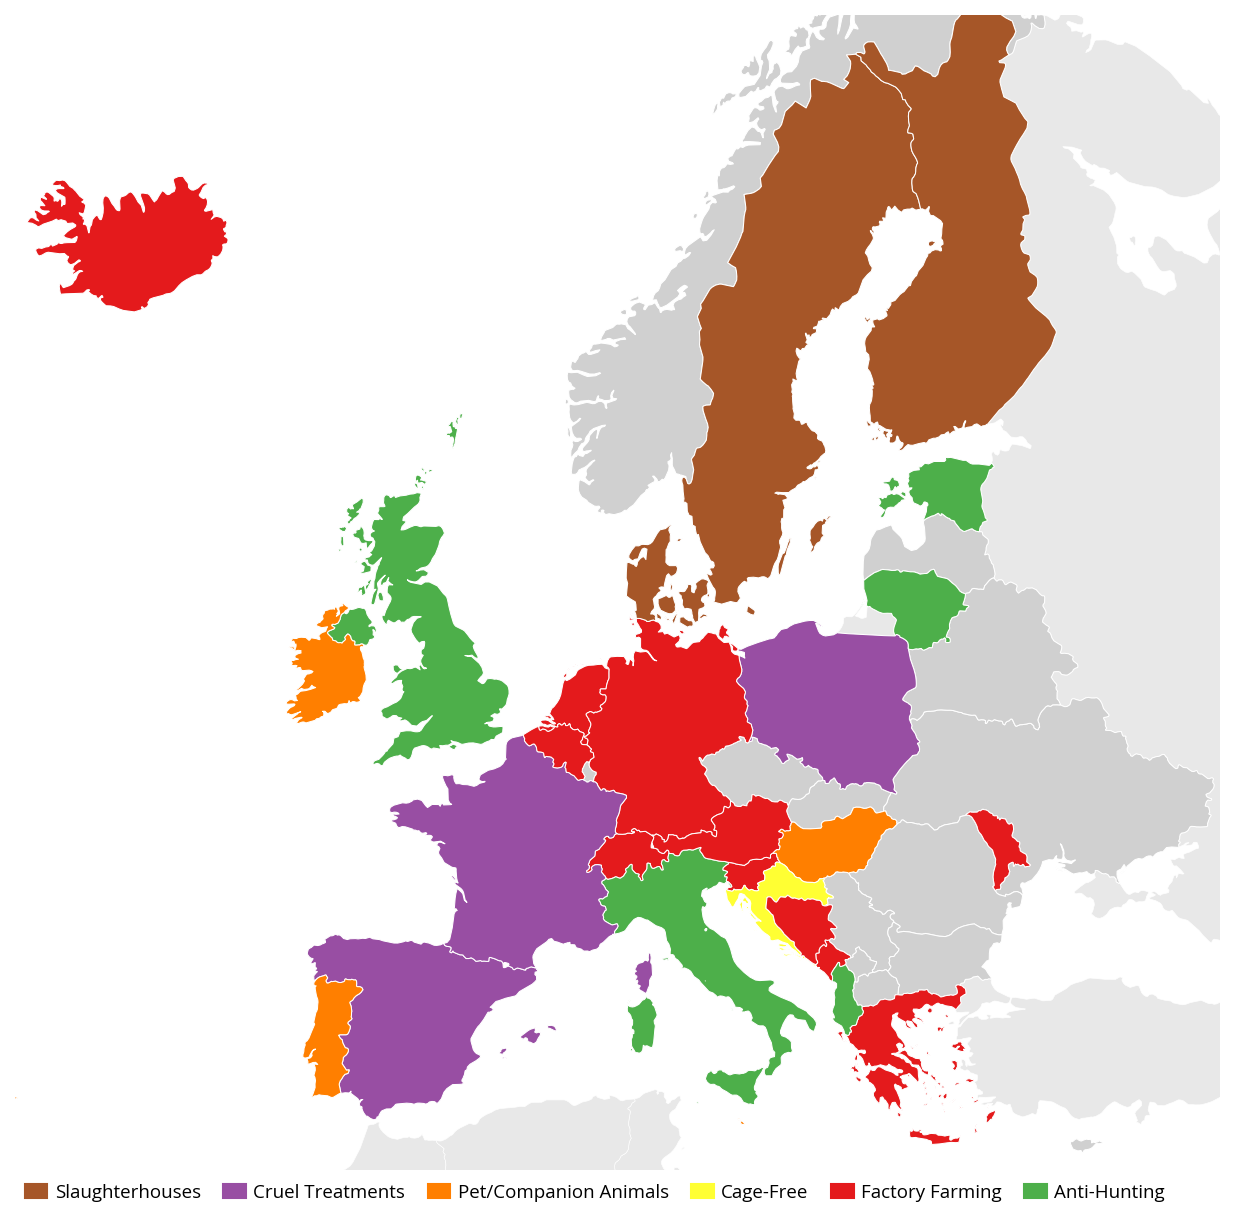
The left map shows how much attention each country’s manifestos give to animal welfare. The right map highlights the dominant frame in each country, excluding the catch-all “General animal welfare” category to emphasize more specific narratives. Frames definitions are detailed below.
Disclaimer: These results are for demonstration purposes only. The analysis should not be relied upon to provide accurate estimates of party positions. Further validation and methodological refinement are needed before these results can be used for research or advocacy purposes.
A central belt (Germany, Netherlands, Belgium, Austria) gives animal welfare more space and mostly leads with factory farming critiques. France, Spain, and Poland mention animal welfare less overall but surface cruelty more often.
Looking across all European parties, Green and animalist parties unsurprisingly rank among the highest in attention to animal welfare.
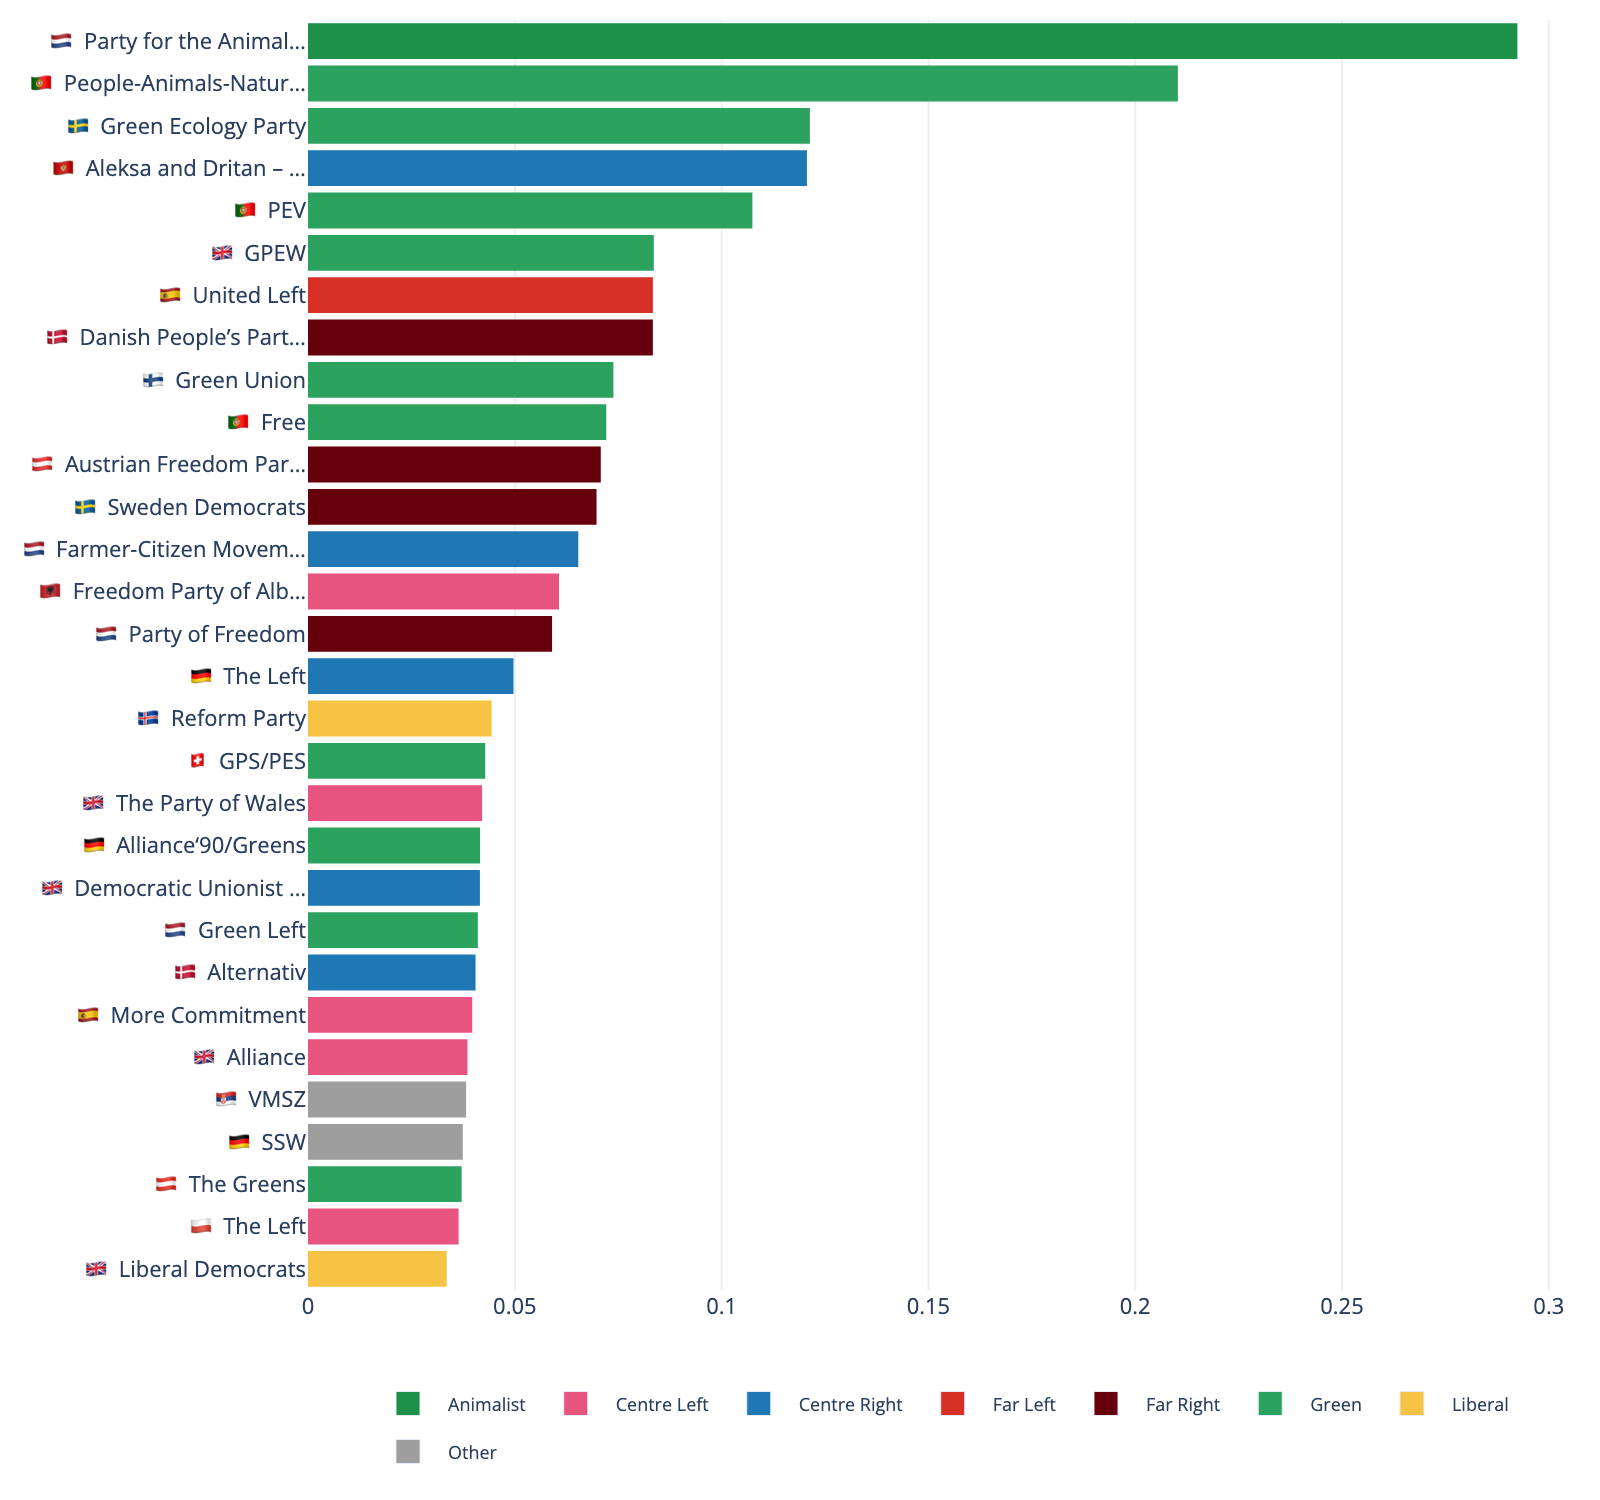
Note: The chart shows the share of each party's manifesto dedicated to animal welfare topics, based on frame classification of manifesto text. Only parties with detectable animal welfare content are shown.
Data Source: Manifestos retrieved via the Manifesto Project.
Disclaimer: These results are for demonstration purposes only. The analysis should not be relied upon to provide accurate estimates of party positions. Further validation and methodological refinement are needed before these results can be used for research or advocacy purposes.
Examining parties within each country reveals more nuanced patterns and even some surprises: in Austria, Denmark and France, for instance, the far-right manifestos refer to animal welfare and its frames the most (see chart below). If confirmed by more in-depth inspection, this surprising pattern could inform advocacy strategy.
Note: Each panel shows parties from a single country, with bars indicating the share of each party's manifesto dedicated to animal welfare topics. Countries are ordered by total attention to animal welfare across all parties.
Data Source: Manifestos retrieved via the Manifesto Project.
Disclaimer: These results are for demonstration purposes only. The analysis should not be relied upon to provide accurate estimates of party positions. Further validation and methodological refinement are needed before these results can be used for research or advocacy purposes.
Strategic applications
For advocacy organizations and strategic funders working on animal welfare, this type of analysis could support several strategic functions:
Map the political landscape: The geographic patterns revealed in the analysis can help advocates and funders understand where certain framings have more political traction. This information can guide decisions about where to invest resources, which messages to prioritize in different contexts, and where there might be opportunities to introduce new frames.
Track party position evolution: By repeating this analysis across election cycles, advocates can monitor whether parties are strengthening, weakening, or shifting their positions on animal welfare. This could provide an evidence base for evaluating the impact of advocacy efforts and identifying which parties might be responsive to further engagement.
Create peer pressure: Comparing party positions within and across countries can help advocates create peer pressure by highlighting which parties lag behind on animal welfare commitments. Publicly mapping party positions relative to their peers can create incentives for parties to strengthen their platforms.
Slaughterhouses and Humane Killing
Discourse around slaughtering practices, abattoirs, humane killing, stunning requirements, and conditions in slaughter facilities.
Cruelty and Inhumane Treatment
Framing of cruelty, abuse, suffering, and inhumane treatment of animals. ONLY assign when cruelty/abuse/suffering is EXPLICITLY mentioned.
Pet and Companion Animals
Discourse specifically about pets, companion animals, domestic animals, breeding practices, pet shops, and animal abandonment.
Cage-Free and Confinement
Framing around cage-free systems, battery cages, confinement, housing conditions, and freedom of movement for farmed animals.
Plant-Based Proteins and Diets
Discourse on plant-based alternatives, meat substitutes, reducing animal consumption, vegan/vegetarian options, and protein transition.
Factory Farming and Industrial Production
Framing of industrial raising of animals for food production (not covering farming of plants).
Anti-Hunting and Snaring
Discourse opposing hunting, trapping, snaring, and other wildlife killing practices, including traditional and sport hunting.
Anti-Laboratory Experiments
Framing against animal testing, vivisection, laboratory experiments on animals, and the push for alternative testing methods.
General Animal Welfare
Broad statements about animal welfare standards, animal protection, and animal rights that do not fit specific frames above. ONLY assign when 'welfare' (or equivalent in other languages) is EXPLICITLY used.
Looking forward
These early experiments only scratch the surface of what narrative analysis could do for advocacy and research. Going forward, several directions seem worth exploring:
- Other mediums: these examples have covered media articles and political manifestos, but the same approach could be extended to TV and radio transcripts, social media, parliamentary debates and court decisions.
- Valence and stance: Understanding how issues are discussed matters as much as whether they are mentioned. Adding sentiment or stance detection could help distinguish between supportive, neutral, and dismissive framings.
- Conditional framing: Beyond tracking which frames appear, future work could look at how they co-occur.
- Validation and reliability: These are exploratory prototypes. Proper validation would probably require some manual annotation and validation, better uncertainty evaluation as well as better checks against overfitting.
Get in touch
I'm looking for advocacy organisations interested in piloting this approach on an existing intervention, and for funders who see value in building shared infrastructure for evidence-based advocacy strategy. If either describes you, I'd welcome a conversation.Method overview
The pipeline follows a hybrid LLM-to-classifier approach: we start with flexible LLM exploration to discover and annotate narrative frames, then scale up with a fine-tuned transformer classifier. This balances domain adaptability (frames tailored to each question and context) with computational efficiency (fast inference over large corpora).

Content discovery: We start by defining the slice of content we care about, whether from media articles, TV news transcripts, radio programs, forums, social media, parlimentary debates, or even court decisions.
Scrape and extract: We fetch pages and extract the main text, then remove boilerplate and navigation tails that otherwise drown the signal
Chunking: We split documents into smaller chunks (~200 words) using spaCy language models. This linguistic approach respects sentence boundaries, paragraph structure, and discourse connectors (words like “however” or “therefore” that should stay attached to their preceding sentences). We use language-specific spaCy models to ensure proper sentence segmentation and preserve semantic coherence. By working with smaller units, we can detect when a single article discusses both vehicle emissions and industrial pollution, even if one frame dominates the overall document.
Frame induction: We ask an LLM to propose a compact set of categories tailored to the question and context (e.g., causes of air pollution in Delhi) by feeding it a random sample of passages (200 passages in the examples above) in several consecutive batches, followed by a consolidation call. User can inject guidance to guide the LLM e.g. to include or exclude certain frames. After a manual and shallow comparison of various models performances through visual inspection of framing results, I selected OpenAI GPT‑4.1 for this step. The resulting schema (names, short definitions, examples, keywords) is passed along to the annotation step.
Sample annotations:
We then use another LLM as a probabilistic annotator on a sample of passages (typically 2,000 passages in the examples above). Each passage gets a distribution over frames (not just a single label) plus a brief rationale. We typically use a smaller GPT‑4 variant (e.g., gpt-4.1-mini) for this step to balance cost and quality, since we need to label thousands of examples. This does two things: it reveals ambiguous cases that keyword-based approaches would mis-label, and it gives us enough labeled data to train a supervised model.
Supervised classifier: We then fine‑tune a multi‑label transformer classifier on those annotated passages using BERT-based models. We start with a pre-trained language model and adapt it to our frame classification task: the encoder layers learn to recognize frame-relevant patterns, while a new classification head outputs probability scores for each frame. In this first design, precision and recall typically stand above 0.85 and 0.75 respectively. Visual validation confirmed that the classifier correctly identifies frames in most cases.
Classify the corpus: The model can then produce fast inference over tens of thousands of chunks.
Aggregate and report: Finally, we aggregate chunk‑level predictions to document‑level profiles and summaries over time. A length‑weighted aggregator estimates how much attention each frame receives within a document.
Why not simply use keywords?
Keyword-based approaches are the simplest starting point for narrative analysis, and they can work reasonably well in some cases. In fact, quick comparisons suggested that a keyword-based approach might have produced broadly similar results for the Delhi example.
That said, keywords come with several limitations that become more noticeable as the analysis grows in scope or complexity:
- Paraphrases and semantic variations: the same idea can be described using different wording. A passage describing “pollution from manufacturing hubs on the city’s outskirts” belongs in the same frame as one mentioning “industrial emissions,” but simple keyword lists might miss one of those. Training a classifier with a large-enough sample size would tend to better capture such semantic variations and implied meaning.
- Distinction of closely-related frames: Keywords may struggle to separate closely related frames (e.g., “factory farming” vs. “animal suffering,” or “natural factors” vs. “seasonal haze”) when such frames share important keywords. By better capturing the context in which these keywords are used, semantic models can better discriminate such frames.
- Cross-language nuance: In multilingual settings, keywords require maintaining separate—and often imperfect—lists for each language. Semantic models are better at capturing equivalent ideas across languages and phrasing variations without manual translation work.
- Extensibility: Semantic models also enable deeper analyses such as named-entity recognition (to identify actors), sentiment or valence (the emotional tone or intensity of coverage), and stance detection (whether the text supports, opposes, or remains neutral toward a specific actor or proposal). These layers are difficult or brittle to implement with keyword rules alone.
In short, keyword approaches are simple and sometimes effective, but semantic methods scale better, generalize across phrasing and languages, and create a base for more granular analyses.
-
Thanks to Michael Johnston for suggesting to look at the Grand National Protest. ↩